Summary
I used a simple computer program to measure my reaction time before and after drinking coffee (either caffeinated or decaffeinated). I conducted the test only once on any given day. I tested caffeinated coffee 20 times, and decaffeinated coffee 20 times, alternating between the two types. I found no significant difference (p=0.40) in my reaction time after drinking decaffeinated coffee. However, after drinking caffeinated coffee, my reaction time dropped by an average of about 6 milliseconds (p=0.000022). The faster reaction time is not surprising and is consistent with effects found in previous studies.
This pilot study was primarily meant as a proof-of-concept. I embarked on this experiment for two main reasons: to gain some hands-on experience in conducting a daily brain-tracking exercise, and to validate the specific reaction-time test (program) that I used. I consider the experiment to be a success on both counts.
Background
I have become increasingly interested in self-experimentation or self-tracking (see also my page about my weight loss using the Shangri-La Diet). My current job is in information technology, but I did some neuroscience research during graduate school—and my true interests lie more in science than in technology. Self-experimentation is a fun, inexpensive, and rewarding way to do science. And there is the potential to discover some important findings that may have broad relevance, such as finding out which foods or supplements act to boost (or, perhaps, hinder) brain function.
I’m intrigued by the idea that changes in reaction time can be used as a proxy to measure changes in cognitive function. Much prior research supports the idea that reaction time is correlated with intelligence (and with other sorts of cognitive function). Traditionally, cognitive function is measured using such tools as the Stanford-Binet Intelligence Scale and the Raven Progressive Matrices test. These psychological tests are time-consuming, are not designed to be self-administered, and are certainly not meant for tracking changes on a daily basis. On the other hand, measuring reaction time is quick and simple, and it can easily be done every day (or even several times per day). For example, Seth Roberts has used self-experimentation to demonstrate that flaxseed oil lowers his reaction time.
I also have a personal stake here. I’m currently 48 years old (as of Dec. 2013). I’m starting to notice a distinct increase in my forgetfulness, and I sometimes have difficulty finding the correct word. Thus, I’m interested in discovering safe, effective ways to improve my brain function.
Methods
Seth Roberts developed a simple reaction-time test that is administered using a computer program. Taking the test involves hitting a number key to match a random target number (2 through 8, inclusive) that is displayed on the screen. The program measures the latency of your response. Only correct answers are included in any subsequent analysis of reaction-time. If you hit the wrong key, the program forces you to repeat the same trial until you press the right key. Data from these “correction trials” is not considered as valid for further analysis. A session consists of 35 individual trials (each of seven digits is presented five times, in random order) and takes about four minutes to complete. I used my left index finger (I’m left-handed) to press the keys. While waiting for the target number to appear, I positioned my finger over the “5” key, usually very lightly touching the surface of the key with my fingertip.
Professor Roberts’s original program was written in the scripting language R. I employed the same basic protocol, but I implemented it in a scripting language called AutoIt. I used AutoIt because it’s free, and because I wanted to learn the language anyway, for potential use in work-related projects. My program outputs the data to a comma-separated value (CSV) file that can then be analyzed in Excel, R, or other package.
Before I started conducting this caffeine pilot study, I performed over 200 practice runs using the computer program. The goal was to train myself to the point where my scores would reach a plateau (i.e., no further learning would occur). When I graphed my practice scores, they did seem to stabilize. In actual fact, however, my reaction times continued to decline somewhat during the experiment itself—but his decline did not hinder the interpretation of the results.
I conducted the tests in mid-to-late morning, usually when I was at the office. I would prepare the coffee at home and bring it to work in a thermos. I used two heaping teaspoons of instant coffee, plus an additional half-teaspoon or so. I chose the amount because that’s about how much I habitually consume in the mornings. I used roughly 12 fluid ounces of hot water, a splash of soy-based creamer, and about a teaspoon of stevia for sweetness. None of the ingredients were measured with any real precision. The test was not blinded: I always knew whether I was drinking caffeinated or decaffeinated coffee. (I should note that on a few occasions, I ended up using brewed coffee instead of instant, but the amount was roughly the same).
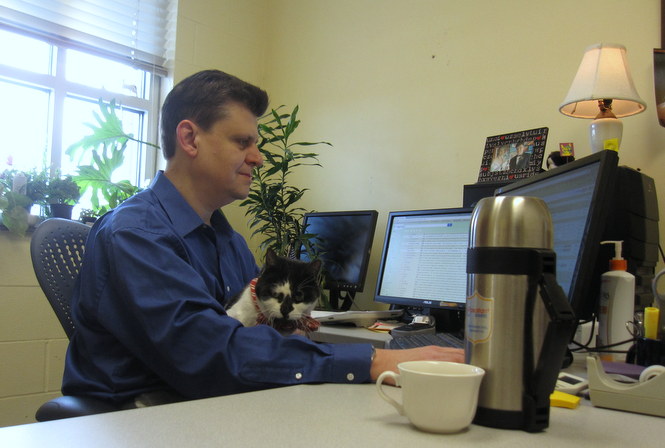
Here’s a photograph of me at my desk, along with my trusty assistant Deca (also note the thermos in the foreground):
My usual routine was to take the reaction-time test around 10:00 AM, then drink all the coffee within a time-span of about 30 minutes. I would then repeat the reaction-time test about an hour after I finished drinking the coffee. My work-related tasks obviously took precedence over conducting the experiment, so my timing necessarily varied a bit from day to day. On weekends, I would perform the tests at home.
On days that I conducted the test using decaffeinated coffee, I would also drink regular (caffeinated) coffee after completing the second reaction-time test—since consuming regular coffee is part of my normal morning routine, and I had no wish to go into caffeine withdrawal.
Results
I analyzed the data using R. The following table shows a top-level summary. Each of the four conditions corresponds to 20 testing sessions of 35 individual trials each (n=700):
| Condition | Mean Reaction Time (n=700 trials for each mean) |
|---|---|
| Pre-caffeine baseline | 343.1 msec |
| Post-caffeine | 336.9 |
| Pre-decaf baseline | 342.4 |
| Post-decaf | 343.6 |
There is no significant difference between the pre-decaf and post-decaf means (p=0.40). However, the difference between the pre-caffeine and post-caffeine conditions is very significant (p=0.000022). I also performed an additional t-test on two other groups. The first group consisted of the twenty differences beween the pre- and post-caffeine means. The second group was the twenty differences between the pre- and post-decaf means (see the third graph below for an illustration of what I mean by “the differences between the means”). The difference between the groups was very significant (p=0.0014).
The raw data file is available for download here: caffeine_pilot.csv.
When the data is graphed, the effect becomes fairly clear (all dates on the horizontal axes are in the year 2013):
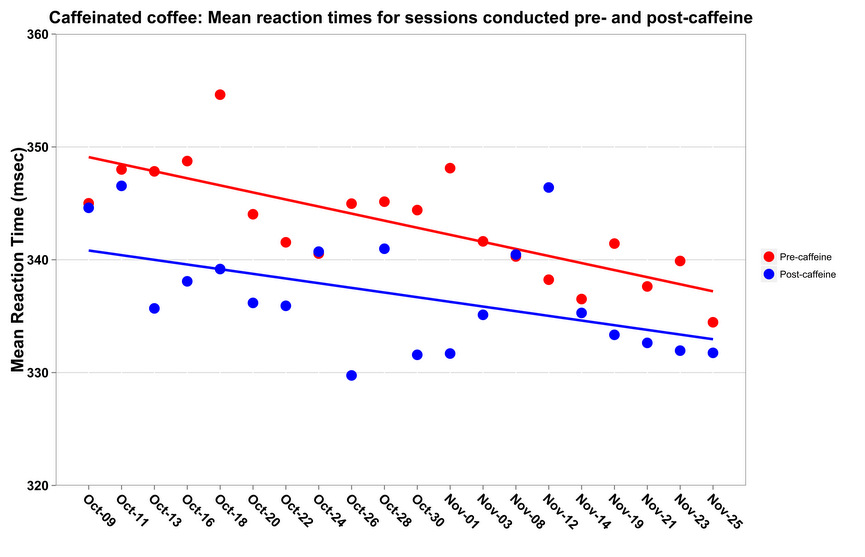
In the graph above, each date (indicated on the horizontal axis) corresponds to two individual reaction-time tests: before and after drinking caffeinated coffee. You can see that most of the blue data points are below the corresponding red points, meaning that the reaction time was lower after drinking caffeinated coffee. The lines indicate the best straight-line fit (linear regression) for the data.
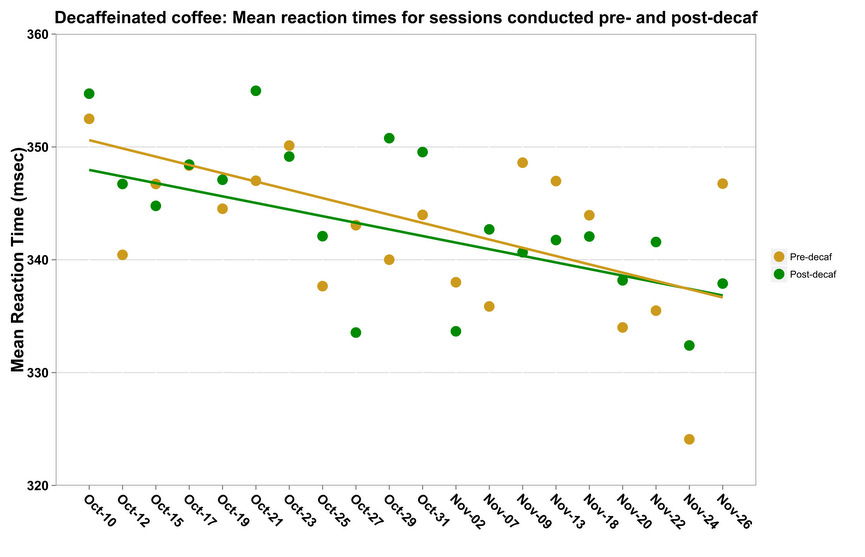
In contrast to the earlier graph, there is no obvious pattern to the relative positions of the pre- and post-decaf data points. Again, the lines indicate the best straight-line fit for the data.
The difference graph shows the difference in scores (post-coffee minus pre-coffee) for the two conditions. Negative numbers indicate a decrease in reaction time for the post condition:
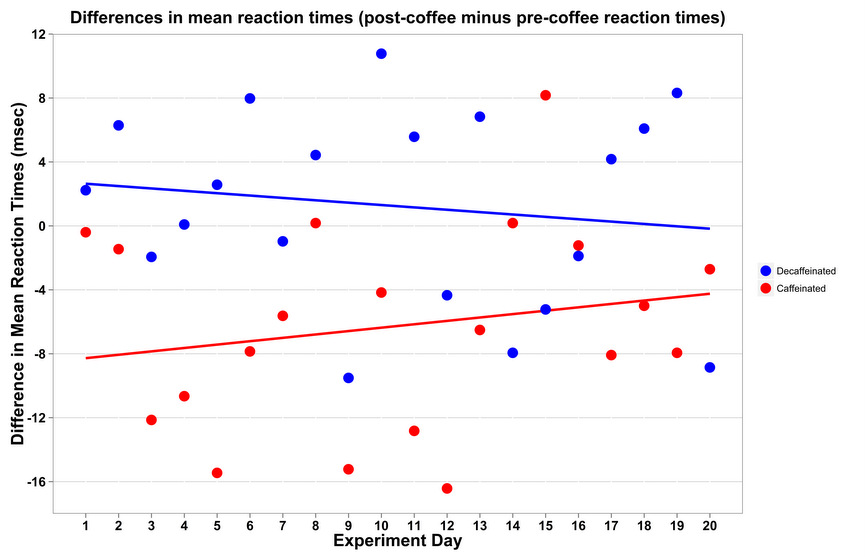
The upward slope of the red line (caffeinated condition) is interesting but seems unlikely to signify a real effect (correlation coefficient r = 0.20). I’ve been drinking caffeinated coffee my whole adult life, and it’s doubtful that caffeine would start to have a reduced effect during the course of this study. In other words, the upward slope is probably an artifact. The correlation coefficient of the other line (differences of decaf means) is -0.14 and is probably just “noise”.
Discussion
The experiment showed clearly that drinking caffeinated coffee lowered my reaction time. While the result itself is only mildly interesting, the real value of the study was to validate the reaction-time test I was using, and also to demonstrate to myself that I’m capable of conducting a months-long self-experimentation study.
